Making of the Application Interface
Here we’ll take a quick peek at the very high level process of creating the interface design for a Signal Processing application. The main goal of this application is to digitally analyze, manipulate, convert and extract data from analogue signals.
Read More
Creating the "Satellites" infographic
Look at the process behind creating the infographic. It includes collecting and sorting the data, sketching the visualization ideas and figuring out the ways of plotting the information.
Read More
Infographic - Exploring the Red Planet
Here’s a little “behind the scenes” process of making this information graphic.
The goal was to show most, if not all, attempts to explore out Red neighbour. I wanted to show successful, partially successful and failed mission launches.
Read More
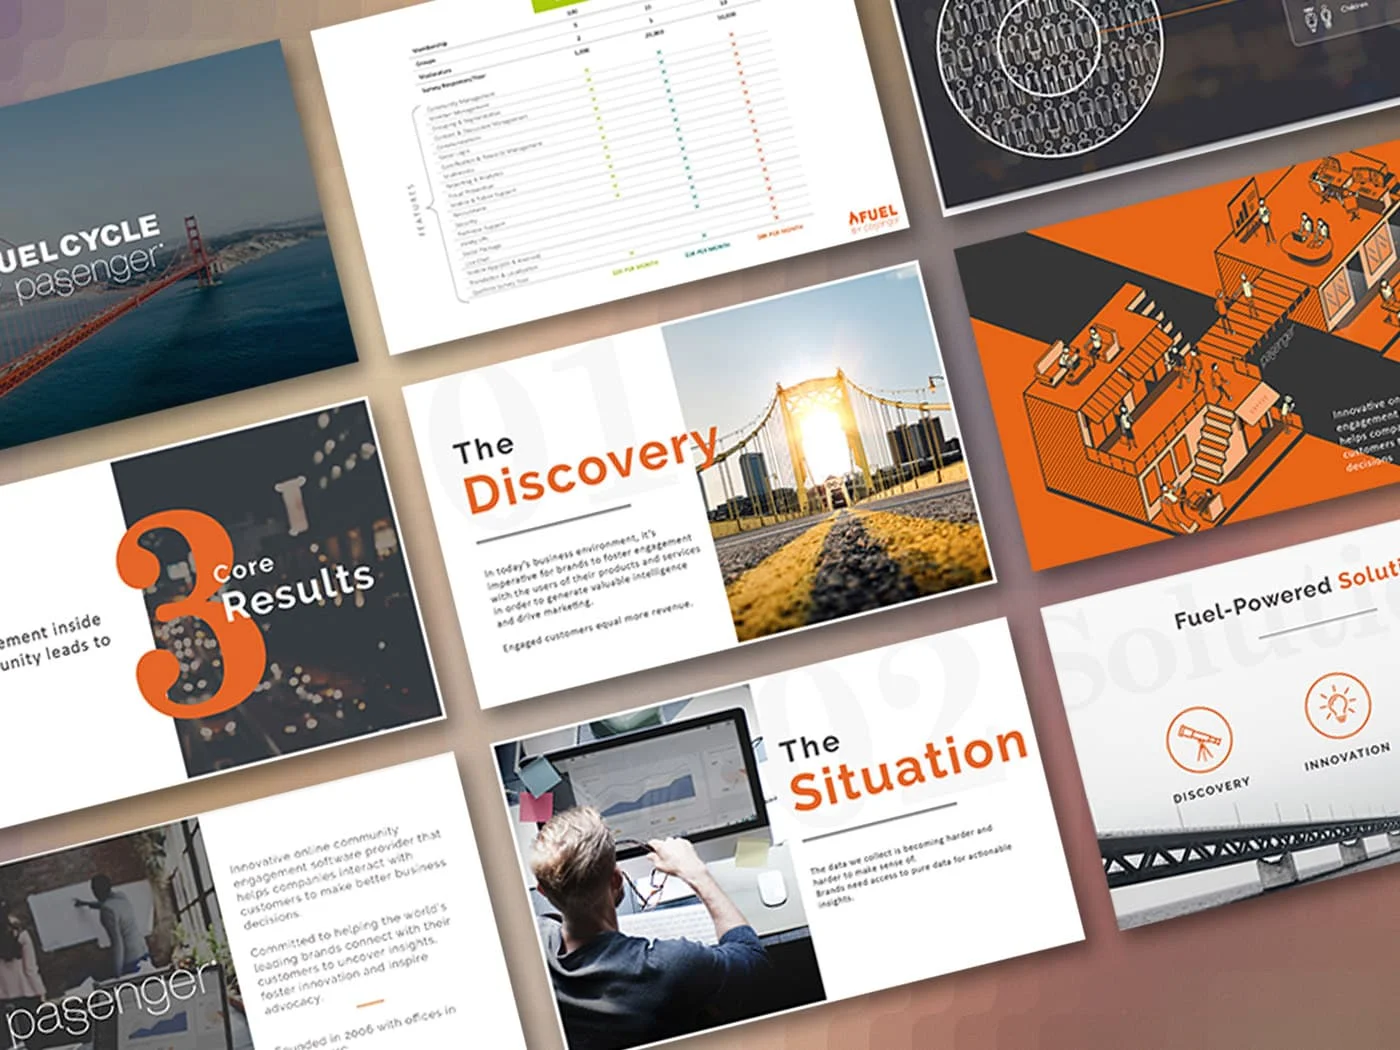
Redesigning a PowerPoint Presentation
I not a believer into templatizing everything. After all, the content is what should drive the look and feel of the deck, not the pre-selected template
Read More
Making of: Visualizing the Excel table data
A look at the process of creating a chart. Based off on the data table and a simple Excel scatter chart, we make this thing a bit splashy.
Read More