
Infographic - Exploring the Red Planet
Here’s a little “behind the scenes” process of making this information graphic.
The goal was to show most, if not all, attempts to explore out Red neighbour. I wanted to show successful, partially successful and failed mission launches.
Using the almighty power of spreadsheets, i created a table with all the necessary preliminary information needed:
- type of mission (orbiting the planet, land on it, or just fly past)
- mission outcome (success, fail, etc)
- date of the mission
- country of Origin

Now that we have the information, time to sketch up some ideas on how to best show this timeline of launches:

Not quite there yet

Getting there
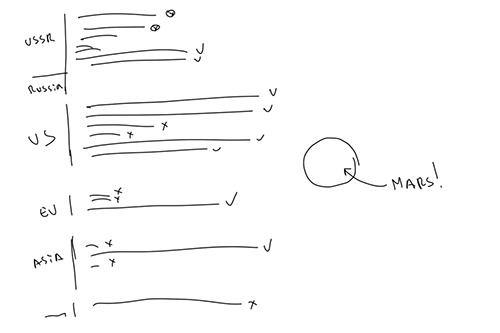
Closer

Bingo!
Now that we have established the direction, time to start creating the graphic.

Setting up the grid

More lines


Details

Carefully creating the mission lines

Adding details


Very Important - Layer organization
That's it!